It’s always good to know what’s going on with your website… whether it’s traffic hitting it or logs detailing errors, this information can be invaluable. The Pressidium Dashboard gives you access to a ton of information available right at your fingertips. Let’s take a look.
WordPress and Web Server Logs
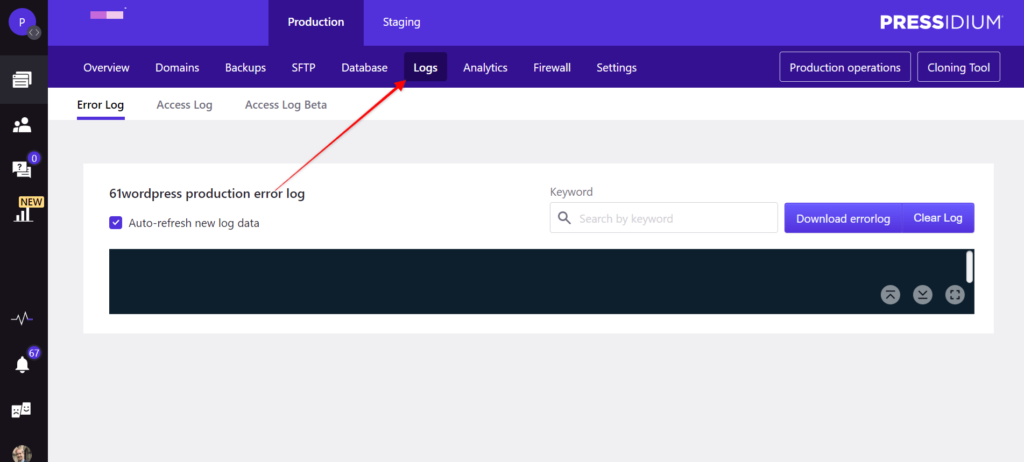
From your Dashboard, click on the website you want to work on and then select the ‘Logs’ tab from the top menu.

You’ll immediately see Error logs (hopefully empty!) and an Access Log. The Access log is disabled by default although access logs for the last 7 days can be downloaded. If you regularly use these, you can enable them.
WordPress Analytics
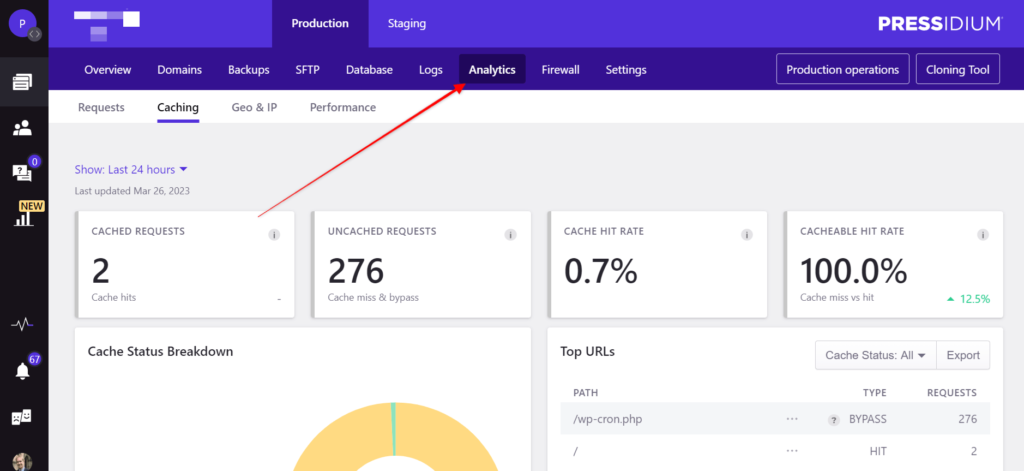
Our feature-rich Analytics suite provides a wealth of information on your website.

View data including Requests, Failed Requests, Caching hit rates, Geo and IP data, and Site Performance. You can filter much of this data and select different date ranges (24hrs up to the last 30 days).
We’ve got a great article that goes into much more detail about the Analytics Suite. Check it out here.
Further Support
For further instructions on using any of these features, you can search our Knowledge Base.
You can also request help from our team 24x7x365 by submitting a Support Ticket from within your Dashboard.


