Website analytics allow you to inspect and review request traffic information captured directly from our backend servers without requiring you to install a client-side Javascript solution.
To access Website Analytics for a website:
- Navigate to the Website Overview page.
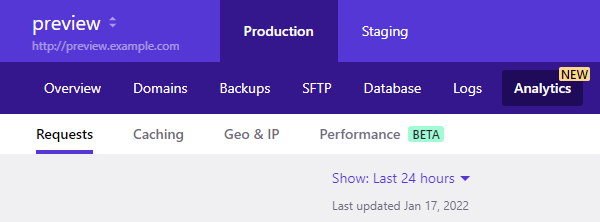
- Click Analytics.
- Analytics information is broken down into 3 different groups. Select one of the Requests, Caching, Geo & IP or Performance menu items to navigate to the respective page.

Web Analytics FAQ
Where does the data come from?
Our primary data source is the raw access logs from our front end/edge nodes.
How often are the data updated?
Analytics data are updated every hour, for hourly analytics, and at the end of each day for daily analytics. There might be an initial delay of up to 1 hour until data are available for new websites. The last update time is visible at the top left corner of each page.
What date/time ranges are supported?
We provide server side analytics for the following date ranges (might vary depending on the type of Analytics):
- Last 24 hours
- Last 7 days (week)
- Last 14 days
- Last 30 days (month)
You can select the desired range using the Show dropdown at the top left corner of each page.

Can I export Analytics Data?
Yes, you can export data table information from our Dashboard Analytics Suite in CSV format for further analysis or post processing. Clicking the “Export” button will trigger a browser file download with the requested data exported as a plain text CSV (comma separated) file. The generated CSV files include a data header in the first line / row. For each data table the exported data reflect the “current” filtered view. i.e. the export includes only the data visible in the applied filtered view and not the entire dataset. This way you can export one or more data views (or the entire unfiltered data set) as separate files.


What does the [variable] query string in Top URLs / Top Paths entries stand for?
We normalize HTTP requests based on HTTP response code and query string names and group them into a single entry. So GET requests to /myblog?version=1 and /myblog?version=2 will be displayed as /myblog/version=[variable] with an aggregated request count.
What do 2xx, 3xx, 4xx, 5xx and 9xx stand for?
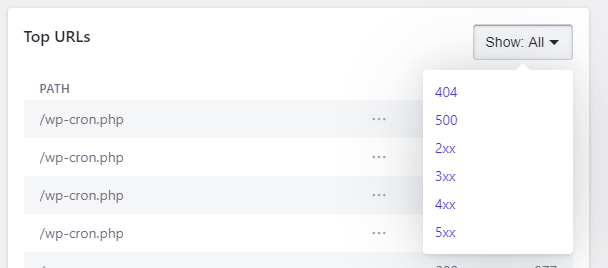
They represent the classes/categories of HTTP response status codes.
- 2xx Successful
- 3xx Redirection
- 4xx Client Error
- 5xx Server Error
- 9xx Pressidium custom response code(s)
You can use the related dropdown filters where available to display results from a single category only or click the chart labels to enable or disable displaying category data in charts.

What is a Cache HIT / MISS / BYPASS
- A cache HIT is an HTTP request served by our Multilayer Adaptive Caching engine.
- A cache MISS is a potentially cacheable request that was not served by the caching layer but directly from the application or web servers. The first time a resource (dynamic or static) is requested it will result in a cache MISS. Subsequent requests for this resource will be served from the cache.
- A cache BYPASS is a request that is not considered for caching based on a set of criteria. Common requests that completely, by default, bypass the cache are HTTP POST requests.
Take a look at our technology page for a quick overview of our fault-tolerant multi-node server architecture and the dedicated Multilayer Adaptive Caching technology.
Is there a way to review why a Path / URL is bypassing the cache?
Yes, by hovering over the info icon (?) on the related entry you can inspect the reason the URL is bypassing Pressidium cache.

Common reasons include:
| Logged In Cookie Detected | The request includes a WordPress user logged-in cookie (active user login session). |
| HTTP POST Request | Responses to HTTP POST requests are by default not cacheable. |
| 302 HTTP Redirect | HTTP response that results in a HTTP redirect. |
| 301 HTTP Redirect | HTTP response that results in a HTTP redirect. |
| XMLHttpRequest (XHR) / AJAX request | AJAX request (https://developer.mozilla.org/en-US/docs/Web/Guide/AJAX/Getting_Started) |
| Non cacheable large file request | Response is a static asset with large file size and should not be cached. |
| Non cacheable URL | URLs such as wp-cron.php (related to WordPress scheduled jobs/cron system), wp-login.php (related to WordPress login flow) and WordPress admin related. |
| Non cacheable e-shop related URL | The request is part of an e-shop related non cacheable flow (e.g. WooCommerce cart update). |
| Customer defined cache exclusion URL | A URL that has been specifically excluded from cache either by the customer or the Pressidium support team. |
| Pressidium Request | Pressidium platform specific URLs. |
What does RPM stand for?
RPM stands for “Requests Per Minute” and it’s a performance metric used to typically measure throughoutput of your website i.e. the number of requests per minute your website receives from users. Your website’s RPM may vary depending on day of week or hour per day and the access patterns of your visitors.
What does “Server Response Time” stand for?
It’s the total processing time (in milliseconds) of a single request. It includes time taken by PHP to process the request as well as any time spent in network, database or filesystem I/O operations.
What is the difference between “Total Request Time” and “Server Response Time”?
Total Request Time includes the server response time and the time taken by the client (browser etc.) to read the response. A client/user with a slow or bandwidth limited connection may result in increased Request Time(s).
What does “Impact” (Performance) stand for?
“Impact” is a calculated relative metric that takes into account the total number of requests for a specific path / URL and the average server response time for this resource in the selected time window. It can be used to identity specific requests that may potentially affect performance or compare performance characteristics of one or more requests:
- A path / URL with a small request count may have a large impact because of a high average response time (e.g. a lengthy bulk action process).
- A path / URL with a small average response time may have a large impact due to a high number of requests. (e.g a WordPress REST API call).
Can I see / filter analytics data based on custom date and/or time range?
This is not currently possible.
NOT ANSWERED YOUR QUESTION? SEARCH AGAIN OR SUBMIT A SUPPORT REQUEST

